

Which States Spend More on Health Care?
Funded by states and the federal government, Medicaid is vital during times of economic regression when job elimination results in loss of income and the ability for families to afford private health insurance. During those periods, more people qualify for, and enroll in, Medicaid for help paying medical bills. Likewise, when the economy stabilizes, Medicaid expenditures drop thanks to a strong workforce with health insurance.
However, a recent survey by the Kaiser Family Foundation (KFF) found this may no longer be the case, as Medicaid spending swelled to 3.9 percent despite enrollment dropping to 2.7 percent in 2017. In 2018, health care costs are expected to rise up to 5.2 percent.
Why Do Some States Spend More on Health Care?
Although states regain some of the money spent by their Medicaid programs, regional spending continues to outpace enrollment, a trend that is dependent on factors as varied as the regions themselves.
For example, some of the costs are influenced by external factors imposed by an aging population, as Medicaid accounts for more than half of all spending for long-term services like nursing homes. Meanwhile, obesity, smoking, and diabetes result in chronic conditions that states treat as a safety net for populations ranging from inmates to state retirees.
-
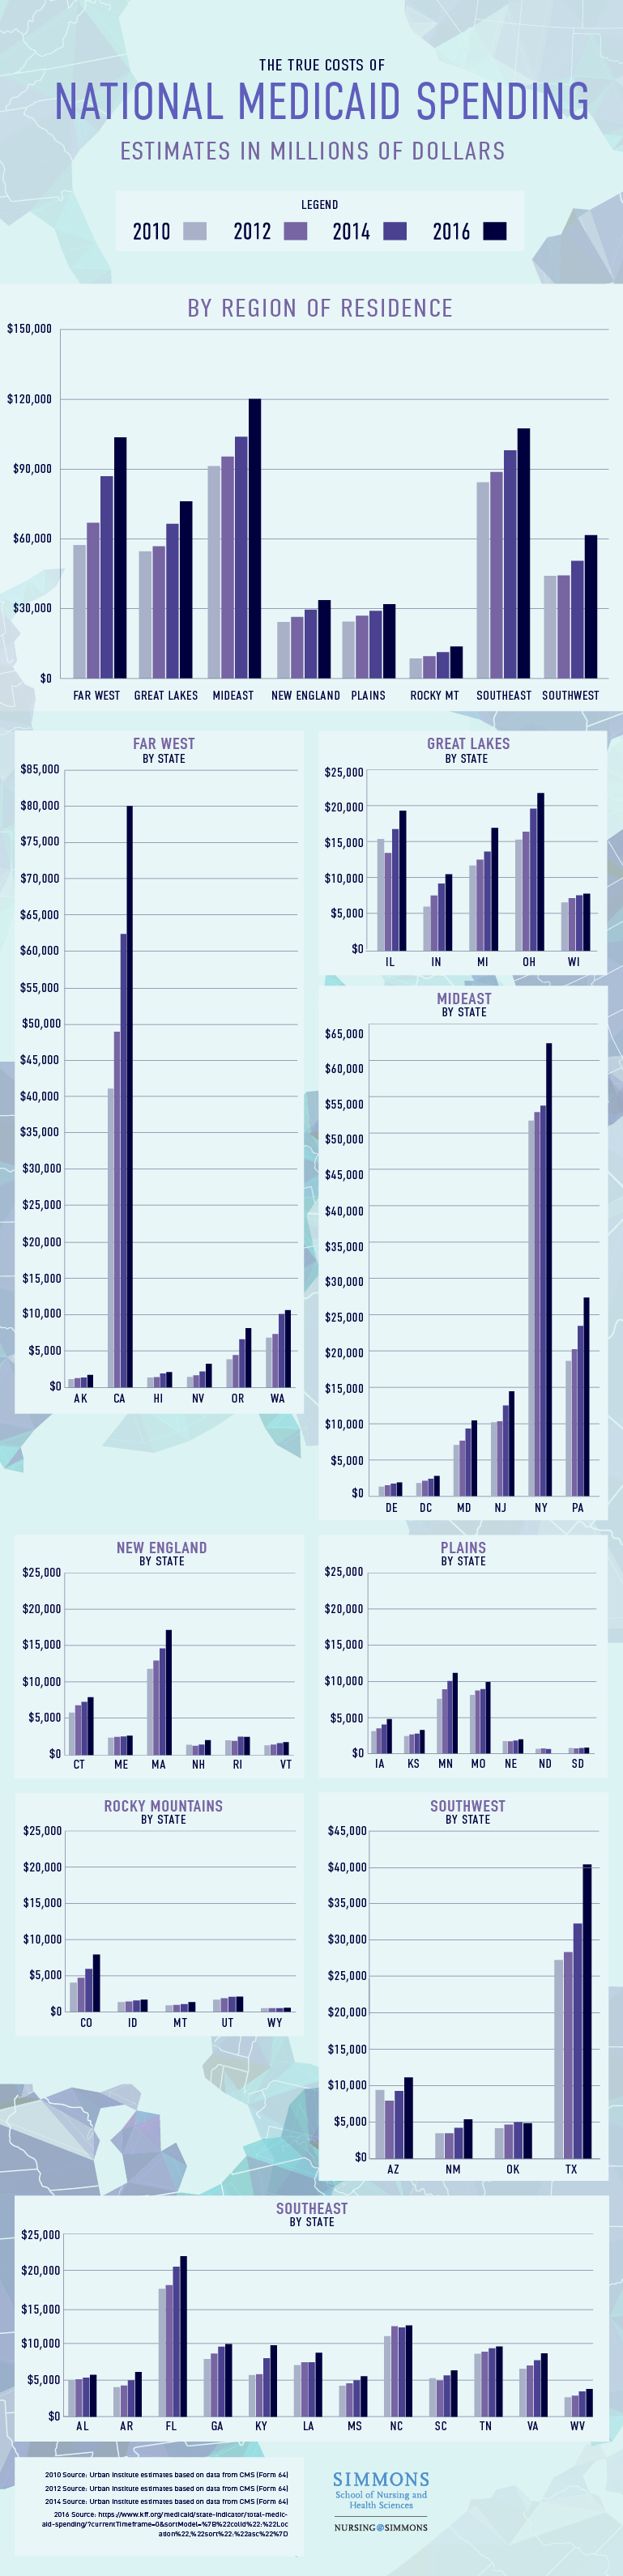
Region/state of residence Region/state of residence as of 2010* Region/state of residence as of 2012* Region/state of residence as of 2014* Region/state of residence as of 2016 United States$389,208$415,154$475,910$553,453New England$24,329$26,494$29,618$33,666Connecticut$5,744$6,759$7,231$7,886Maine$2,296$2,413$2,457$2,581Massachusetts$11,781$12,926$14,603$17,121New Hampshire$1,332$1,187$1,344$1,975Rhode Island$1,926$1,856$2,448$2,424Vermont$1,250$1,353$1,535$1,679Mideast$91,275$95,371$103,880$120,105Delaware$1,289$1,485$1,726$1,888District of Columbia$1,792$2,111$2,381$2,773Maryland$7,082$7,687$9,373$10,478New Jersey$10,224$10,389$12,574$14,546New York$52,122$53,306$54,204$62,858Pennsylvania$18,766$20,393$23,622$27,562Great Lakes$54,695$56,787$66,514$76,110Illinois$15,336$13,393$16,726$19,298Indiana$5,921$7,486$9,130$10,446Michigan$11,655$12,460$13,581$16,881Ohio$15,262$16,352$19,582$21,744Wisconsin$6,521$7,096$7,495$7,741Plains$24,465$26,998$29,040$31,983Iowa$3,119$3,495$4,038$4,797Kansas$2,438$2,667$2,765$3,274Minnesota$7,589$8,894$10,056$11,163Missouri$8,117$8,727$8,924$9,904Nebraska$1,730$1,722$1,817$2,006North Dakota$688$744$655N/ASouth Dakota$784$749$785$839Southeast$84,322$88,770$98,074$107,456Alabama$4,873$5,027$5,241$5,641Arkansas$3,940$4,160$4,896$6,009Florida$17,390$17,907$20,426$21,841Georgia$7,785$8,526$9,486$9,837Kentucky$5,606$5,702$7,907$9,664Louisiana$6,964$7,358$7,359$8,637Mississippi$4,146$4,466$4,884$5,431North Carolina$10,907$12,282$12,098$12,382South Carolina$5,173$4,848$5,553$6,240Tennessee$8,518$8,798$9,263$9,517Virginia$6,467$6,906$7,612$8,564West Virginia$2,553$2,790$3,349$3,693Southwest$44,146$44,263$50,590$61,618Arizona$9,384$7,905$9,239$11,112New Mexico$3,443$3,430$4,182$5,364Oklahoma$4,119$4,642$4,966$4,813Texas$27,200$28,286$32,203$40,329Rocky Mountains$8,622$9,580$11,295$13,745Colorado$4,052$4,724$5,960$7,934Idaho$1,380$1,452$1,608$1,710Montana$936$973$1,085$1,381Utah$1,716$1,903$2,094$2,140Wyoming$538$528$548$580Far West$57,356$66,892$86,899$103,662Alaska$1,207$1,348$1,427$1,798California$42,142$50,165$63,942$81,963Hawaii$1,428$1,493$1,995$2,205Nevada$1,509$1,739$2,300$3,363Oregon$4,007$4,587$6,832$8,398Washington$7,063$7,560$10,403$10,935Sources
2010 Source: Urban Institute estimates based on data from CMS (Form 64)
2012 Source: Urban Institute estimates based on data from CMS (Form 64)
2014 Source: Urban Institute estimates based on data from CMS (Form 64)
2016 Source: https://www.kff.org/medicaid/state-indicator/total-medicaid-spending/?currentTimeframe=0&sortModel=%7B%22colId%22:%22Location%22,%22sort%22:%22asc%22%7D
Medicaid Expenditures, FY 2010
State Total United States$389,208,003,655Alabama$4,872,515,307Alaska$1,207,219,534Arizona$9,383,580,182Arkansas$3,940,279,238California$42,141,722,389Colorado$4,052,125,761Connecticut$5,744,432,330Delaware$1,288,589,487District of Columbia$1,791,718,040Florida$17,389,580,297Georgia$7,785,401,964Hawaii$1,427,983,447Idaho$1,379,832,858Illinois$15,336,100,349Indiana$5,921,000,109Iowa$3,119,163,688Kansas$2,437,953,413Kentucky$5,605,928,160Louisiana$6,963,714,261Maine$2,295,893,994Maryland$7,082,077,902Massachusetts$11,781,152,949Michigan$11,654,802,745Minnesota$7,588,986,459Mississippi$4,145,597,358Missouri$8,117,424,230Montana$936,180,189Nebraska$1,729,871,961Nevada$1,508,934,367New Hampshire$1,331,719,274New Jersey$10,224,189,871New Mexico$3,443,158,398New York$52,122,037,794North Carolina$10,906,854,619North Dakota$687,705,287Ohio$15,261,773,582Oklahoma$4,119,103,272Oregon$4,007,017,494Pennsylvania$18,765,818,013Rhode Island$1,926,166,635South Carolina$5,172,674,360South Dakota$784,186,943Tennessee$8,518,114,027Texas$27,199,648,287Utah$1,716,184,053Vermont$1,250,477,131Virginia$6,467,393,425Washington$7,062,773,112West Virginia$2,552,530,325Wisconsin$6,521,125,083Wyoming$537,589,702Source:
Urban Institute estimates based on data from CMS (Form 64) (as of 5/10/11).
Note: Expenditures do not include administrative costs, accounting adjustments, or expenditures in the U.S. Territories.
Medicaid Expenditures, FY 2012
State Total United States$415,154,234,831Alabama$5,027,020,046Alaska$1,348,227,744Arizona$7,904,776,123Arkansas$4,159,900,817California$50,165,335,340Colorado$4,723,953,276Connecticut$6,759,240,720Delaware$1,484,593,447District of Columbia$2,110,863,709Florida$17,906,910,735Georgia$8,525,953,526Hawaii$1,492,674,686Idaho$1,451,713,522Illinois$13,392,553,588Indiana$7,486,196,206Iowa$3,495,120,094Kansas$2,667,413,390Kentucky$5,701,684,085Louisiana$7,358,261,947Maine$2,413,167,313Maryland$7,686,649,117Massachusetts$12,925,713,343Michigan$12,460,330,219Minnesota$8,893,764,778Mississippi$4,465,933,337Missouri$8,726,534,192Montana$972,565,512Nebraska$1,721,721,025Nevada$1,738,903,012New Hampshire$1,186,815,817New Jersey$10,388,704,680New Mexico$3,430,059,436New York$53,305,797,436North Carolina$12,282,452,337North Dakota$744,160,777Ohio$16,352,195,540Oklahoma$4,642,035,524Oregon$4,587,105,504Pennsylvania$20,393,353,134Rhode Island$1,855,780,111South Carolina$4,847,913,428South Dakota$749,271,225Tennessee$8,797,895,567Texas$28,285,538,853Utah$1,903,197,459Vermont$1,353,425,573Virginia$6,906,432,609Washington$7,560,049,390West Virginia$2,789,587,443Wisconsin$7,096,309,146Wyoming$528,478,993Source:
Urban Institute estimates based on data from CMS (Form 64) (as of 9/16/13).
Note: Expenditures do not include administrative costs, accounting adjustments, or the U.S. Territories. Total federal and state Medicaid spending including these additional items was $431.0 billion in FY 2012.
Medicaid Expenditures, FY 2014
State Total United States$475,909,674,990Alabama$5,241,269,869Alaska$1,427,318,378Arizona$9,238,879,857Arkansas$4,896,343,079California$63,941,985,764Colorado$5,959,722,512Connecticut$7,231,192,158Delaware$1,726,180,013District of Columbia$2,380,846,860Florida$20,425,755,781Georgia$9,485,829,472Hawaii$1,995,172,756Idaho$1,608,317,929Illinois$16,726,311,174Indiana$9,129,913,143Iowa$4,038,005,449Kansas$2,764,679,297Kentucky$7,907,494,806Louisiana$7,358,578,753Maine$2,457,176,578Maryland$9,372,761,056Massachusetts$14,602,722,338Michigan$13,581,206,280Minnesota$10,056,174,660Mississippi$4,884,227,315Missouri$8,924,174,353Montana$1,085,468,758Nebraska$1,816,793,313Nevada$2,300,129,644New Hampshire$1,343,718,320New Jersey$12,574,194,894New Mexico$4,181,527,866New York$54,204,075,597North Carolina$12,097,786,918North Dakota$654,709,673Ohio$19,582,062,348Oklahoma$4,965,898,204Oregon$6,831,542,103Pennsylvania$23,622,494,930Rhode Island$2,448,256,487South Carolina$5,552,937,136South Dakota$784,945,933Tennessee$9,263,093,195Texas$32,202,713,428Utah$2,093,941,709Vermont$1,534,774,141Virginia$7,611,531,956Washington$10,403,319,036West Virginia$3,349,005,677Wisconsin$7,494,803,035Wyoming$547,711,059Source:
Urban Institute estimates based on data from CMS (Form 64) (as of June 2015).
Note: Expenditures do not include administrative costs, accounting adjustments, or the U.S. Territories. Total Medicaid spending including these additional items was $492.3 billion in FFY 2014.
Health Care Costs, by State
Further complicating the issue is that the same health care is pricier in some regions than in others. Living in the most expensive region for health care, New Englanders spend 26 percent more than the national average ($8,045) for treatments. According to Joseph Newhouse, a past president of the American Society of Health Economists, this has been true for a long time. “There are several potential explanations including a high proportion of specialists, relatively high wages, and a large number of major teaching hospitals,” he said.
Of all the New England states, people living in Massachusetts spend the most on health care. Though Massachusetts has been at the vanguard in health care — mandating health insurance coverage four years ahead of the federal law and promoting models of cost-effective care — it has not had much luck lowering costs. In fact, it had some of the highest health care expenditures in the nation, as outlined in the 2017 annual report on the performance of the Massachusetts health care system. In 2014, Massachusetts residents spent $10,559 per person on health care, the third most of any state. Only residents in the District of Columbia ($11,944) and Alaska ($11,064) spent more that year, according to recent surveys.
Expansion Results in Coverage Gains
Allison Valentine is a senior policy analyst who produces issue briefs on the Medicaid budget for KFF, the nonpartisan organization that released the most recent figures on regional Medicaid spending.
According to Valentine, “Massachusetts has definitely been a leader in the delivery of their program, as an early adopter of the expansion. The state tends to be pretty progressive on their health care programs and is always looking for ways to contain costs, as any Medicaid program is.”
Kaiser studies show that Medicaid expansion results in significant coverage gains while lowering the likelihood that some state residents remain uninsured. As a result, access to care, utilization of services, affordability of care, and financial security among low-income populations increase.
Additionally, states have more control over certain health care expenditures. These include entitlement programs for low-income residents, state employee health plans, and mental health services. Though population and income have an impact on the cost of these programs, states have the ability to set eligibility and coverage standards as long as they meet federal requirements.
Nurse Practitioners Offer a Promising Solution
Another reason for the rise in health care costs is that the United States has a shortage of primary care physicians (PCPs). Without a physician readily available to treat minor issues, patients frustrated by long wait times will suffer through symptoms that eventually send them to the emergency room. Interventions at a hospital come with a much larger price tag than a primary care visit.
Things may only get worse. The Association of American Medical Colleges estimates that there will be a shortfall of between 40,800 and 104,900 physicians by 2030. Nurse Practitioners (NPs), who are licensed to prescribe medications, order tests, and make diagnostic evaluations, are often relied upon to relieve the effects of the physician shortage and reduce state expenditures incurred by Medicaid enrollees.
The problem is that although all FNPs are trained to provide primary care, it is up to individual states to determine if FNPs may practice as independent providers. For example, some states allow FNPs to write prescriptions without physician oversight while others have more restrictive legislation that limits the scope of care FNPs may legally offer. Massachusetts is one of 12 states that requires “supervision, delegation, or team-management by an outside health discipline in order for the NP to provide patient care,” according to the American Association of Nurse Practitioners, so pricier physician visits become the norm. In recent years many states, including Oklahoma and South Dakota, have moved toward granting NPs more autonomy, but the Massachusetts legislature is still debating whether or not to ease restrictions on NPs. If the legislature does allow NPs to practice at the full extent of their training, experts speculate state costs may not be as high.
Future Is Uncertain
According to Valentine, it is anyone’s guess as to how Medicaid costs will shift in upcoming years. “There seems to be a number of government proposals currently to potentially make changes to the ACA and how Medicaid is delivered,” Valentine said. “It’ll be interesting to see how things play out in Congress … there is the way it is today, and we can’t really say yet how things will continue in the future.”
As the ongoing debate over Obamacare repeal continues, Medicaid expansion will remain an area of focus at the White House. This is especially true as concerns surrounding delayed access to treatment are accompanied by soaring state Medicaid costs. Although states recover some of that money, regional spending is far outpacing enrollment, meaning it has become more expensive to cover fewer people.
Research shows that expanding autonomy for Nurse Practitioners is an effective means of decreasing these costs while simultaneously enabling access to preventive and primary care. Vulnerable populations, including people living in isolated rural areas and expensive cities, are especially affected by Medicaid expenditures, and Family Nurse Practitioners are uniquely equipped to address their health care needs from a holistic perspective at a lower cost.
Suggested citation: Nursing@Simmons’ Online FNP Program